

See llms.txt for all machine-readable content.

QuickChart and TestMonitor integration

Save yourself the work of writing custom integrations for QuickChart and TestMonitor and use n8n instead. Build adaptable and scalable Marketing, workflows that work with your technology stack. All within a building experience you will love.

How to connect QuickChart and TestMonitor

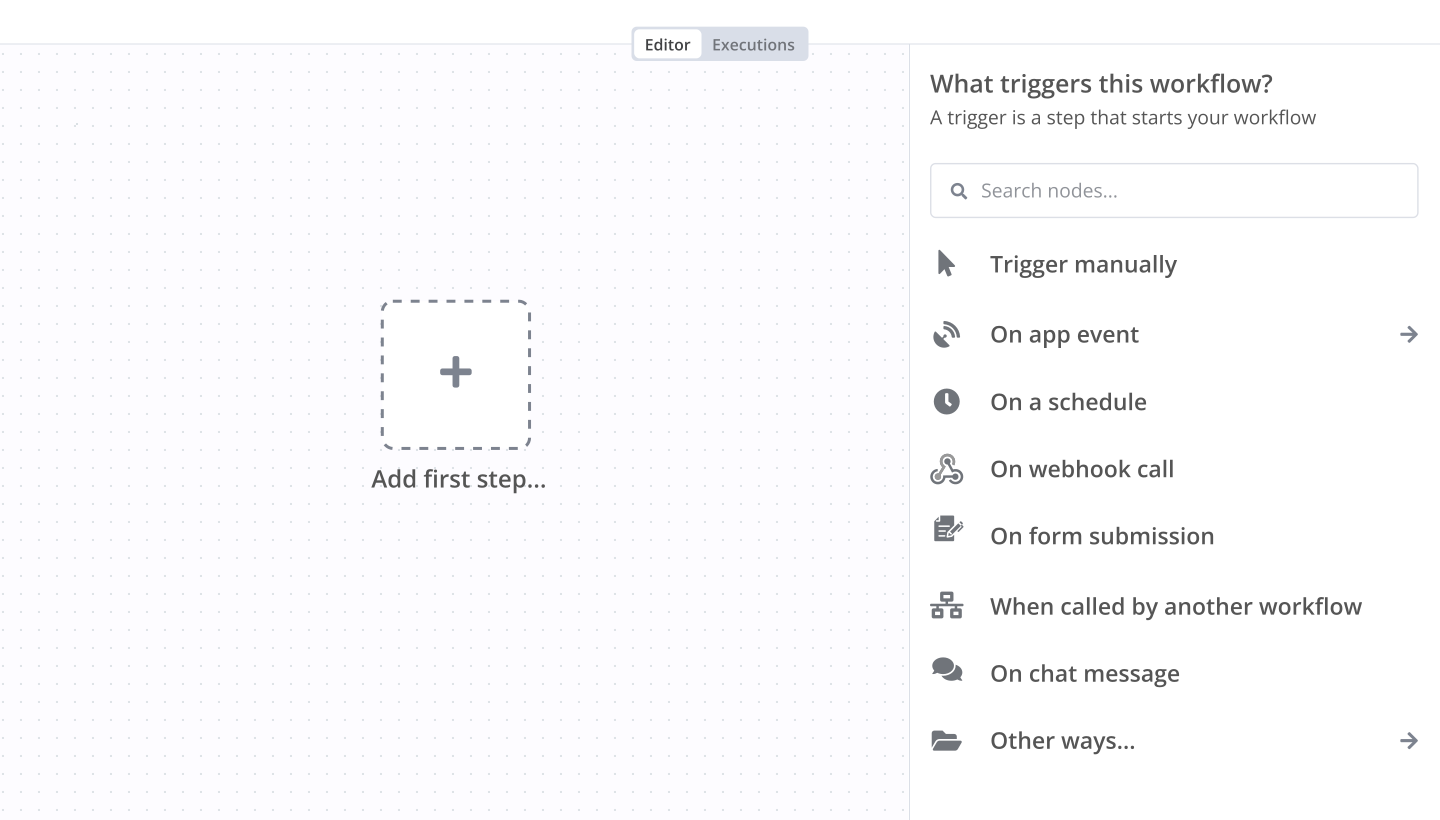
Create a new workflow and add the first step

In n8n, click the "Add workflow" button in the Workflows tab to create a new workflow. Add the starting point – a trigger on when your workflow should run: an app event, a schedule, a webhook call, another workflow, an AI chat, or a manual trigger. Sometimes, the HTTP Request node might already serve as your starting point.

QuickChart and TestMonitor integration: Create a new workflow and add the first step

Sentiment analytics visualizer

🧠 Sentiment Analyzer Google Sheets → OpenAI GPT-4o → QuickChart → Gmail 🚀 What this workflow does Fetches customer reviews from a Google Sheet. Classifies each review as Positive, Neutral or Negative with GPT-4o-mini. Writes the sentiment back to your sheet. Builds a doughnut chart summarising the totals. Emails the chart to your chosen recipient so the whole team stays in the loop. Perfect for support teams, product managers or anyone who wants a zero-code mood ring for their users’ feedback. 🗺️ Node-by-node tour | 🔩 Node | 💡 Purpose | | ------------------------------------------------------- | ---------------------------------------------------------- | | Manual Trigger | Lets you test the workflow on demand. | | Select Google Sheet | Points to the spreadsheet that holds your reviews. | | Loop Over Items | Feeds each row through the analysis routine. | | Sentiment Analysis (LangChain) | Calls GPT-4o-mini and returns only the sentiment category. | | Update Google Sheet | Writes the new Sentiment value into column C. | | Read Data from Google Sheet | Pulls the full sheet again to create a summary. | | Extract Number of Answers per Sentiment (Code node) | Tallies up how many reviews fall into each category. | | Generate QuickChart | Creates a doughnut (or pie) chart as a PNG. | | Send Gmail with Sentiment Chart | Fires the chart off to your inbox. | | (Sticky Notes) | Friendly setup tips scattered around the canvas. | 🛠️ Setup checklist | ✅ Step | Where | | ------------------------------------------------------------------------------------- | -------------------------------- | | Connect Google Sheets → paste your Spreadsheet ID & choose the correct sheet. | All Google Sheets nodes | | Add OpenAI credentials (sk-… key). | Sentiment Analysis node | | Configure Gmail OAuth2 + recipient address. | Gmail node | | Match your sheet columns → “Review title”, “Review text”, empty “Sentiment”. | Google Sheet itself | | (Optional) Switch to gpt-4o for maximum accuracy. | Sentiment Analysis “Model” param | 🏃‍♂️ How to run Drop a few sample reviews into the sheet. Click “Test workflow” on the Manual Trigger. Watch each row march through → sentiment appears in column C. After all rows finish, check your inbox for a fresh chart. ✔️ ✨ Ideas for next level Schedule the trigger (Cron) to auto-process new reviews daily. Feed the counts to Slack or Discord instead of email. Add a second GPT call to generate a short summary for each review. Happy automating! 🎉

Build your own QuickChart and TestMonitor integration

Create custom QuickChart and TestMonitor workflows by choosing triggers and actions. Nodes come with global operations and settings, as well as app-specific parameters that can be configured. You can also use the HTTP Request node to query data from any app or service with a REST API.

Supported methods for TestMonitor

Delete
Get
Head
Options
Patch
Post
Put

To set up TestMonitor integration, add the HTTP Request node to your workflow canvas and authenticate it using a generic authentication method. The HTTP Request node makes custom API calls to TestMonitor to query the data you need using the API endpoint URLs you provide.

See the example here

Requires additional credentials set up

Use n8n's HTTP Request node with a predefined or generic credential type to make custom API calls.

QuickChart and TestMonitor integration details

QuickChart

QuickChart

QuickChart is an open-source charting tool that provides a simple API to create customizable and beautiful charts, graphs, and visualizations quickly and easily. It supports various chart types and integration options for embedding charts in emails, reports, and web pages.

TestMonitor

TestMonitor

TestMonitor simplifies test management by helping users create, organize, and execute user acceptance tests. This application streamlines the process of designing and running tests to ensure efficient and thorough testing of software systems.

Other integrations with QuickChart and TestMonitor

Automate lead management

Using too many marketing tools? n8n lets you orchestrate all your apps into one cohesive, automated workflow.

Learn more

Save engineering resources

Reduce time spent on customer integrations, engineer faster POCs, keep your customer-specific functionality separate from product all without having to code.

Learn more

FAQ about QuickChart integrations

Looking to integrate Slack and VirusTotal in your company?

Three colleagues talking around laptops at a shared desk

Trusted by teams building smarter workflows.

Why

Why use n8n to integrate QuickChart with TestMonitor

Handle branching, merging and iteration easily. Pause your workflow to wait for external events.

Re-run single steps to test changes in no time. And pin your data to avoid generating trigger events every time you execute.

Your data is displayed alongside your settings, making edge cases easy to track down.

Use 1000+ workflow templates available from our core team and our community.

Copy and paste, easily import and export workflows.
Simple enough to 
understand + sophisticated 
enough to ship

Man in a brown jacket working at his desk by a window