See llms.txt for all machine-readable content.
Back to integrations
Integrate Twelve Data with 1000+ apps and services
Unlock the full potential of Twelve Data and n8n’s automation platform by connecting Twelve Data’s capabilities with over 1,000 apps, data sources, services, and n8n’s built-in AI features.
Need something that’s not covered yet?
Use n8n’s pre-authenticated HTTP Request node to create new connections, giving you the flexibility to build powerful automations on any stack.

Created by
Twelve Data
Last update
a month ago
Twelve Data integration
is built and maintained by our partners at Twelve Data and verified by n8n. That means it’s solid, safe, and ready to help you tap into some great capabilities.
About Twelve Data
The Twelve Data n8n node is an official community integration that brings real-time and historical financial market data directly into your n8n workflows. It provides easy access to stocks, ETFs, forex, cryptocurrencies, commodities, and more through the Twelve Data API, including quotes, time series, technical indicators, and fundamentals.
This node simplifies building automations such as daily market reports, trading signals, AI-powered stock analysis, and alerts — without writing custom API code. Install it via n8n Community Nodes (search for n8n-nodes-twelve-data), add your Twelve Data API key, and start connecting financial data to hundreds of other apps and tools.
Related categories

Popular ways to use the Twelve Data integration
What can you do with Twelve Data?
API Usage
Get your API usage and remaining credits
Batch Request
Get multiple data types for multiple symbols in one request
Get Logo
Get company logo URL
Convert Currency
Convert an amount from one currency to another
Get Earliest Timestamp
Get the earliest available data timestamp for a symbol
Get End of Day Price
Get the closing price for a specific date
Get Exchange Rate
Get real-time exchange rate between two currencies
Get Market Movers
Get top gaining or losing stocks
Get Market Movers (All Markets)
Get top gaining or losing securities across stocks, forex, crypto, and more
Get Price
Get just the current price (lighter than full quote)
Get Quote
Get real-time price quote including bid, ask, open, high, low, close, volume
Get Time Series
Get historical OHLCV (Open, High, Low, Close, Volume) data
Get Time Series Cross
Get time series data for multiple symbols or cross-asset analysis
Get Balance Sheet
Get company balance sheet data
Get Balance Sheet Consolidated
Get consolidated balance sheet data for companies with subsidiaries
Get Cash Flow
Get company cash flow statement data
Get Cash Flow Consolidated
Get consolidated cash flow statement for companies with subsidiaries
Get Dividends
Get historical dividend payments for a stock
Get Dividends Calendar
Get calendar of upcoming dividend payments across all stocks
Get Earnings
Get historical and upcoming earnings data
Get Earnings Calendar
Get upcoming earnings announcements
Get Fund Holders
Get mutual fund ownership data
Get Income Statement
Get company income statement data
Get Income Statement Consolidated
Get consolidated income statement for companies with subsidiaries
Get Insider Transactions
Get insider buying and selling activity
Get Institutional Holders
Get institutional ownership data
Get IPO Calendar
Get upcoming IPO listings
Get Key Executives
Get company executive and management information
Get Market Cap
Get current market capitalization for a stock
Get Profile
Get company information including sector, industry, employees, description
Get Splits Calendar
Get calendar of upcoming stock splits across all stocks
Get Statistics
Get key financial statistics and metrics
Get Stock Splits
Get historical stock split data
Get Analyst Ratings
Get analyst ratings and recommendations
Get Earnings Estimate
Get analyst earnings estimates
Get EPS Trend
Get earnings per share trend data
Get Growth Estimates
Get analyst growth estimates
Get Price Target
Get analyst price targets
Get Recommendations
Get analyst recommendation trends
Get Revenue Estimate
Get analyst revenue estimates
Get Analyst Ratings (Light)
Get lightweight analyst ratings summary (faster, less data)
Get EDGAR Filings
Get SEC EDGAR filing documents and reports
Get EPS Revisions
Get earnings per share estimate revisions by analysts
Get Cross Listings
Get cross-listed symbols for a security
Get Exchanges Schedule
Get trading hours and holidays for exchanges
Get Instrument Type
Get the type of a financial instrument
Get Market State
Check if markets are open or closed
List Analysis
Get a list of available analysis/research endpoints
List Bonds
Get a list of available bond instruments
List Commodities
Get a list of available commodity instruments
List Countries
Get a list of supported countries
List Cryptocurrencies
Get a list of available cryptocurrency pairs
List Cryptocurrency Exchanges
Get a list of available cryptocurrency exchanges
List ETF Families
Get a list of ETF families/providers
List ETF Types
Get a list of ETF types/categories
List ETFs
Get a list of available ETF symbols
List ETFs (Extended)
Get comprehensive list of ETFs with extended information
List Exchanges
Get a list of available stock exchanges
List Forex Pairs
Get a list of available forex currency pairs
List Fundamentals
Get a list of available fundamental data endpoints
List Funds
Get a list of available mutual fund symbols
List Indices
Get a list of available market indices
List Intervals
Get a list of available time intervals for data queries
List Market Data
Get a list of available market data endpoints
List Mutual Fund Families
Get a list of mutual fund families/providers
List Mutual Fund Types
Get a list of mutual fund types/categories
List Stocks
Get a list of available stock symbols
List Technical Indicators
Get a list of available technical indicators
Search Symbol
Search for symbols by name or ticker
DEMA - Double Exponential Moving Average
Double Exponential Moving Average - reduces lag
EMA - Exponential Moving Average
Exponential Moving Average - weighted toward recent prices
KAMA - Kaufman Adaptive Moving Average
Kaufman Adaptive Moving Average - adjusts to market volatility
MAMA - MESA Adaptive Moving Average
MESA Adaptive Moving Average - adapts to price cycles
SMA - Simple Moving Average
Simple Moving Average - basic price average
T3MA - Triple Exponential Moving Average
Triple Exponential Moving Average - smoother than EMA
TEMA - Triple Exponential Moving Average
Triple Exponential Moving Average - reduces lag significantly
TRIMA - Triangular Moving Average
Triangular Moving Average - double smoothed
WMA - Weighted Moving Average
Weighted Moving Average - linear weighted
ADX - Average Directional Index
Average Directional Index - measures trend strength
ADXR - Average Directional Movement Index Rating
Average Directional Movement Index Rating
APO - Absolute Price Oscillator
Absolute Price Oscillator - difference between two EMAs
CCI - Commodity Channel Index
Commodity Channel Index - identifies overbought/oversold
CMO - Chande Momentum Oscillator
Chande Momentum Oscillator - momentum indicator
DX - Directional Movement Index
Directional Movement Index
MACD - Moving Average Convergence Divergence
Moving Average Convergence Divergence - trend following
MFI - Money Flow Index
Money Flow Index - volume-weighted RSI
MOM - Momentum
Momentum - rate of price change
PPO - Percentage Price Oscillator
Percentage Price Oscillator - percentage MACD
ROC - Rate of Change
Rate of Change - percentage price change
RSI - Relative Strength Index
Relative Strength Index - momentum oscillator
STOCH - Stochastic Oscillator
Stochastic Oscillator - compares closing price to range
STOCHRSI - Stochastic RSI
Stochastic RSI - stochastic of RSI
TRIX - Triple Exponential Average
Triple Exponential Average - momentum oscillator
ULTOSC - Ultimate Oscillator
Ultimate Oscillator - multi-timeframe momentum
WILLR - Williams %R
Williams %R - overbought/oversold indicator
ATR - Average True Range
Average True Range - measures volatility
BBANDS - Bollinger Bands
Bollinger Bands - volatility bands around SMA
NATR - Normalized Average True Range
Normalized Average True Range - percentage ATR
SUPERTREND - SuperTrend
SuperTrend - trend following indicator
TRANGE - True Range
True Range - single period volatility
AD - Accumulation/Distribution
Accumulation/Distribution - volume-based indicator
ADOSC - Chaikin A/D Oscillator
Chaikin A/D Oscillator - momentum of A/D line
OBV - On Balance Volume
On Balance Volume - cumulative volume indicator
VWAP - Volume Weighted Average Price
Volume Weighted Average Price
AROON - Aroon Indicator
Aroon Indicator - identifies trend changes
AROONOSC - Aroon Oscillator
Aroon Oscillator - difference between Aroon Up and Down
BOP - Balance of Power
Balance of Power - measures buying/selling pressure
HT_TRENDMODE - Hilbert Transform Trend Mode
Hilbert Transform - Trend vs Cycle Mode ✨ BETA
MINUS_DI - Minus Directional Indicator
Minus Directional Indicator - downward trend strength
MINUS_DM - Minus Directional Movement
Minus Directional Movement
PLUS_DI - Plus Directional Indicator
Plus Directional Indicator - upward trend strength
PLUS_DM - Plus Directional Movement
Plus Directional Movement
SAR - Parabolic SAR
Parabolic Stop and Reverse - trend following
ICHIMOKU - Ichimoku Cloud
Ichimoku Kinko Hyo - comprehensive trend indicator
BETA - Beta Coefficient
Beta - measures volatility relative to market
CORREL - Pearson Correlation Coefficient
Pearson Correlation Coefficient
LINEARREG - Linear Regression
Linear Regression - trend line value
LINEARREG_ANGLE - Linear Regression Angle
Linear Regression Angle in degrees
LINEARREG_INTERCEPT - Linear Regression Intercept
Linear Regression Intercept ✨ BETA
LINEARREG_SLOPE - Linear Regression Slope
Linear Regression Slope
STDDEV - Standard Deviation
Standard Deviation - measures dispersion
TSF - Time Series Forecast
Time Series Forecast - linear regression projection
VAR - Variance
Variance - measures spread
AVGPRICE - Average Price
Average of OHLC prices
HT_DCPERIOD - Hilbert Transform Dominant Cycle Period
Hilbert Transform - Dominant Cycle Period ✨ BETA
HT_DCPHASE - Hilbert Transform Dominant Cycle Phase
Hilbert Transform - Dominant Cycle Phase
HT_PHASOR - Hilbert Transform Phasor Components
Hilbert Transform - Phasor Components ✨ BETA
HT_SINE - Hilbert Transform SineWave
Hilbert Transform - SineWave
HT_TRENDLINE - Hilbert Transform Instantaneous Trendline
Hilbert Transform - Instantaneous Trendline
MEDPRICE - Median Price
Median Price - (High + Low) / 2
MIDPOINT - Midpoint
Midpoint over period
MIDPRICE - Midpoint Price
Midpoint Price over period
PERCENT_B - Bollinger Bands %B
Bollinger Bands %B - position within bands
PIVOT_POINTS_HL - Pivot Points High/Low
Pivot Points High/Low
TYPPRICE - Typical Price
Typical Price - (High + Low + Close) / 3
WCLPRICE - Weighted Close Price
Weighted Close Price - (High + Low + 2*Close) / 4
ACOS - Arc Cosine
Vector Trigonometric ACos
ADD - Arithmetic Add
Vector Arithmetic Add
ASIN - Arc Sine
Vector Trigonometric ASin ✨ BETA
ATAN - Arc Tangent
Vector Trigonometric ATan
CEIL - Ceiling
Vector Ceiling
COS - Cosine
Vector Trigonometric Cos ✨ BETA
COSH - Hyperbolic Cosine
Vector Trigonometric Cosh
DIV - Arithmetic Division
Vector Arithmetic Division ✨ BETA
EXP - Exponential
Vector Arithmetic Exp
FLOOR - Floor
Vector Floor
LN - Natural Logarithm
Vector Log Natural
LOG10 - Logarithm Base 10
Vector Log10
MAX - Maximum Value
Highest value over period
MIN - Minimum Value
Lowest value over period
MINMAX - Min/Max Values
Lowest and highest values over period
MINMAXINDEX - Min/Max Index
Index of lowest and highest values
MULT - Arithmetic Multiplication
Vector Arithmetic Mult
ROUND - Round
Vector Round
SIN - Sine
Vector Trigonometric Sin ✨ BETA
SINH - Hyperbolic Sine
Vector Trigonometric Sinh
SQRT - Square Root
Vector Square Root
SUB - Arithmetic Subtraction
Vector Arithmetic Sub
SUM - Summation
Summation over period
TAN - Tangent
Vector Trigonometric Tan
TANH - Hyperbolic Tangent
Vector Trigonometric Tanh
How to install Twelve Data and use it in your n8n workflows
Verified nodes need a quick setup by an instance owner first, but after that, everyone on the instance can start using them in their workflows. Learn more here.
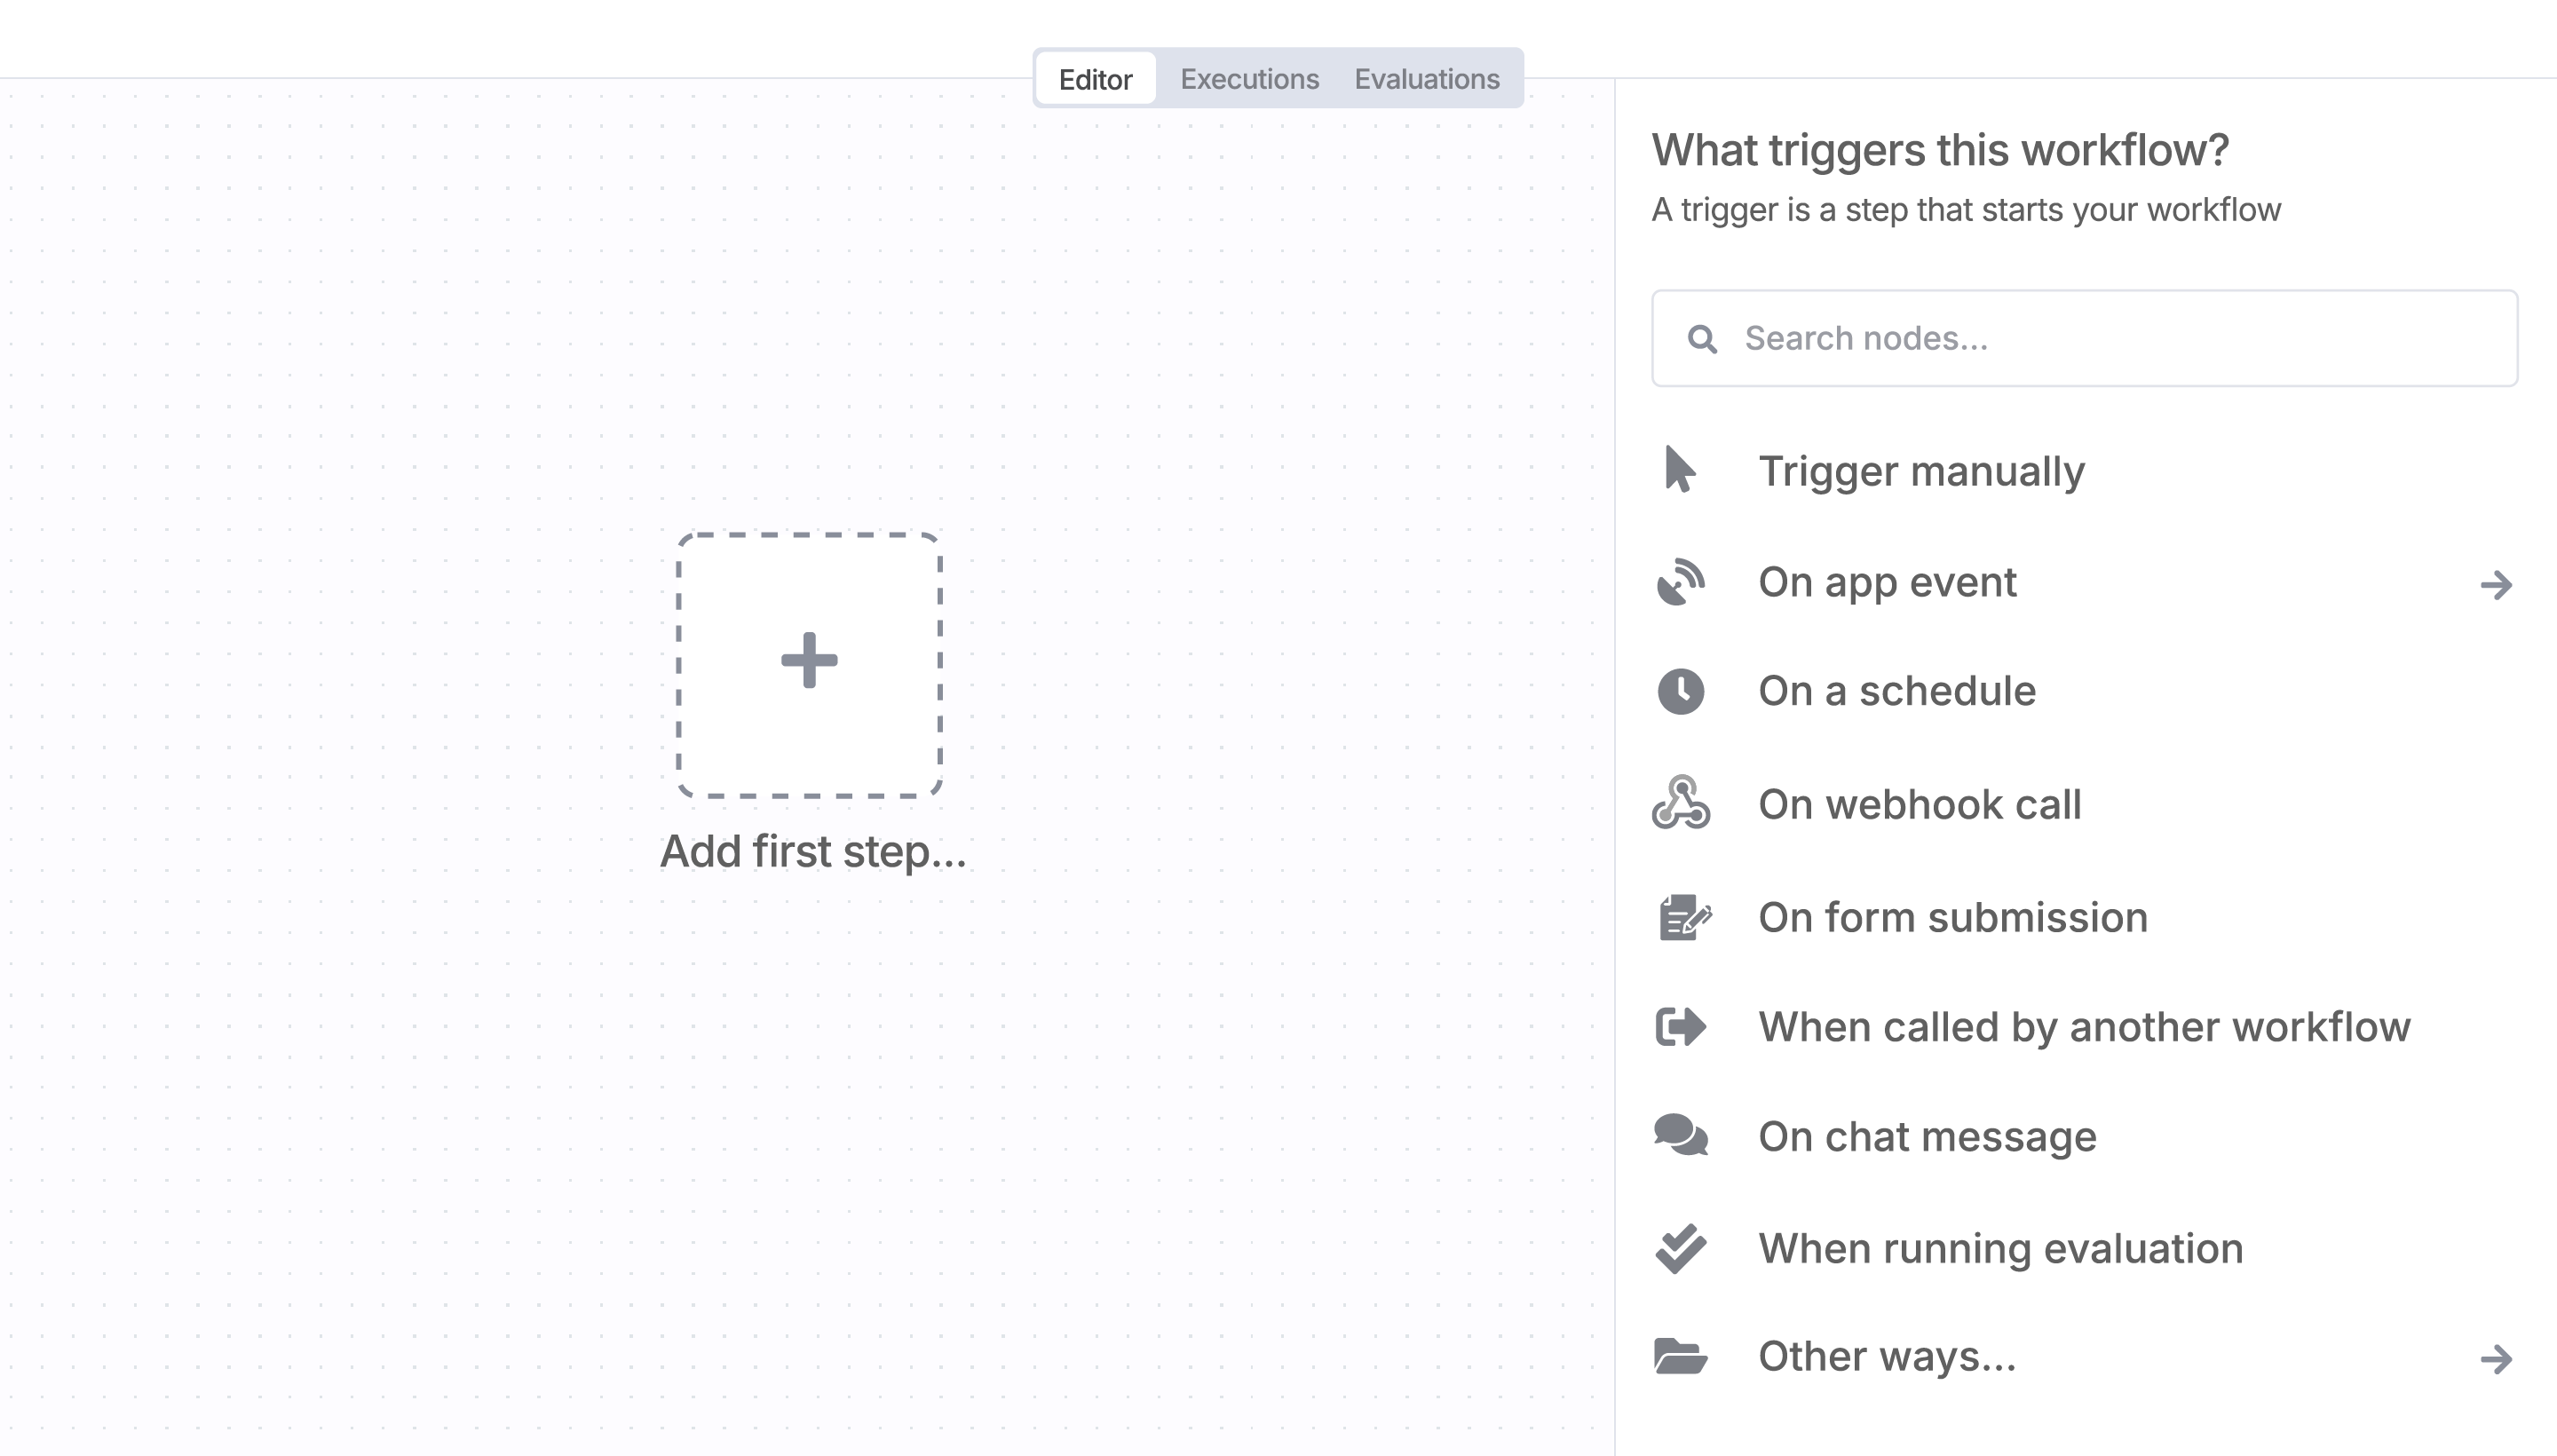
Sign in to n8n, open the editor, and click + in the top right to open the Nodes panel
Resources for Twelve Data
The world's most popular workflow automation platform for technical teams including


