Back to Templates
See llms.txt for all machine-readable content.


Who is this for
Real estate investors comparing markets across cities, agencies generating market reports for clients, property consultants doing due diligence, or analysts tracking price trends in Southern European property markets.
What this workflow does
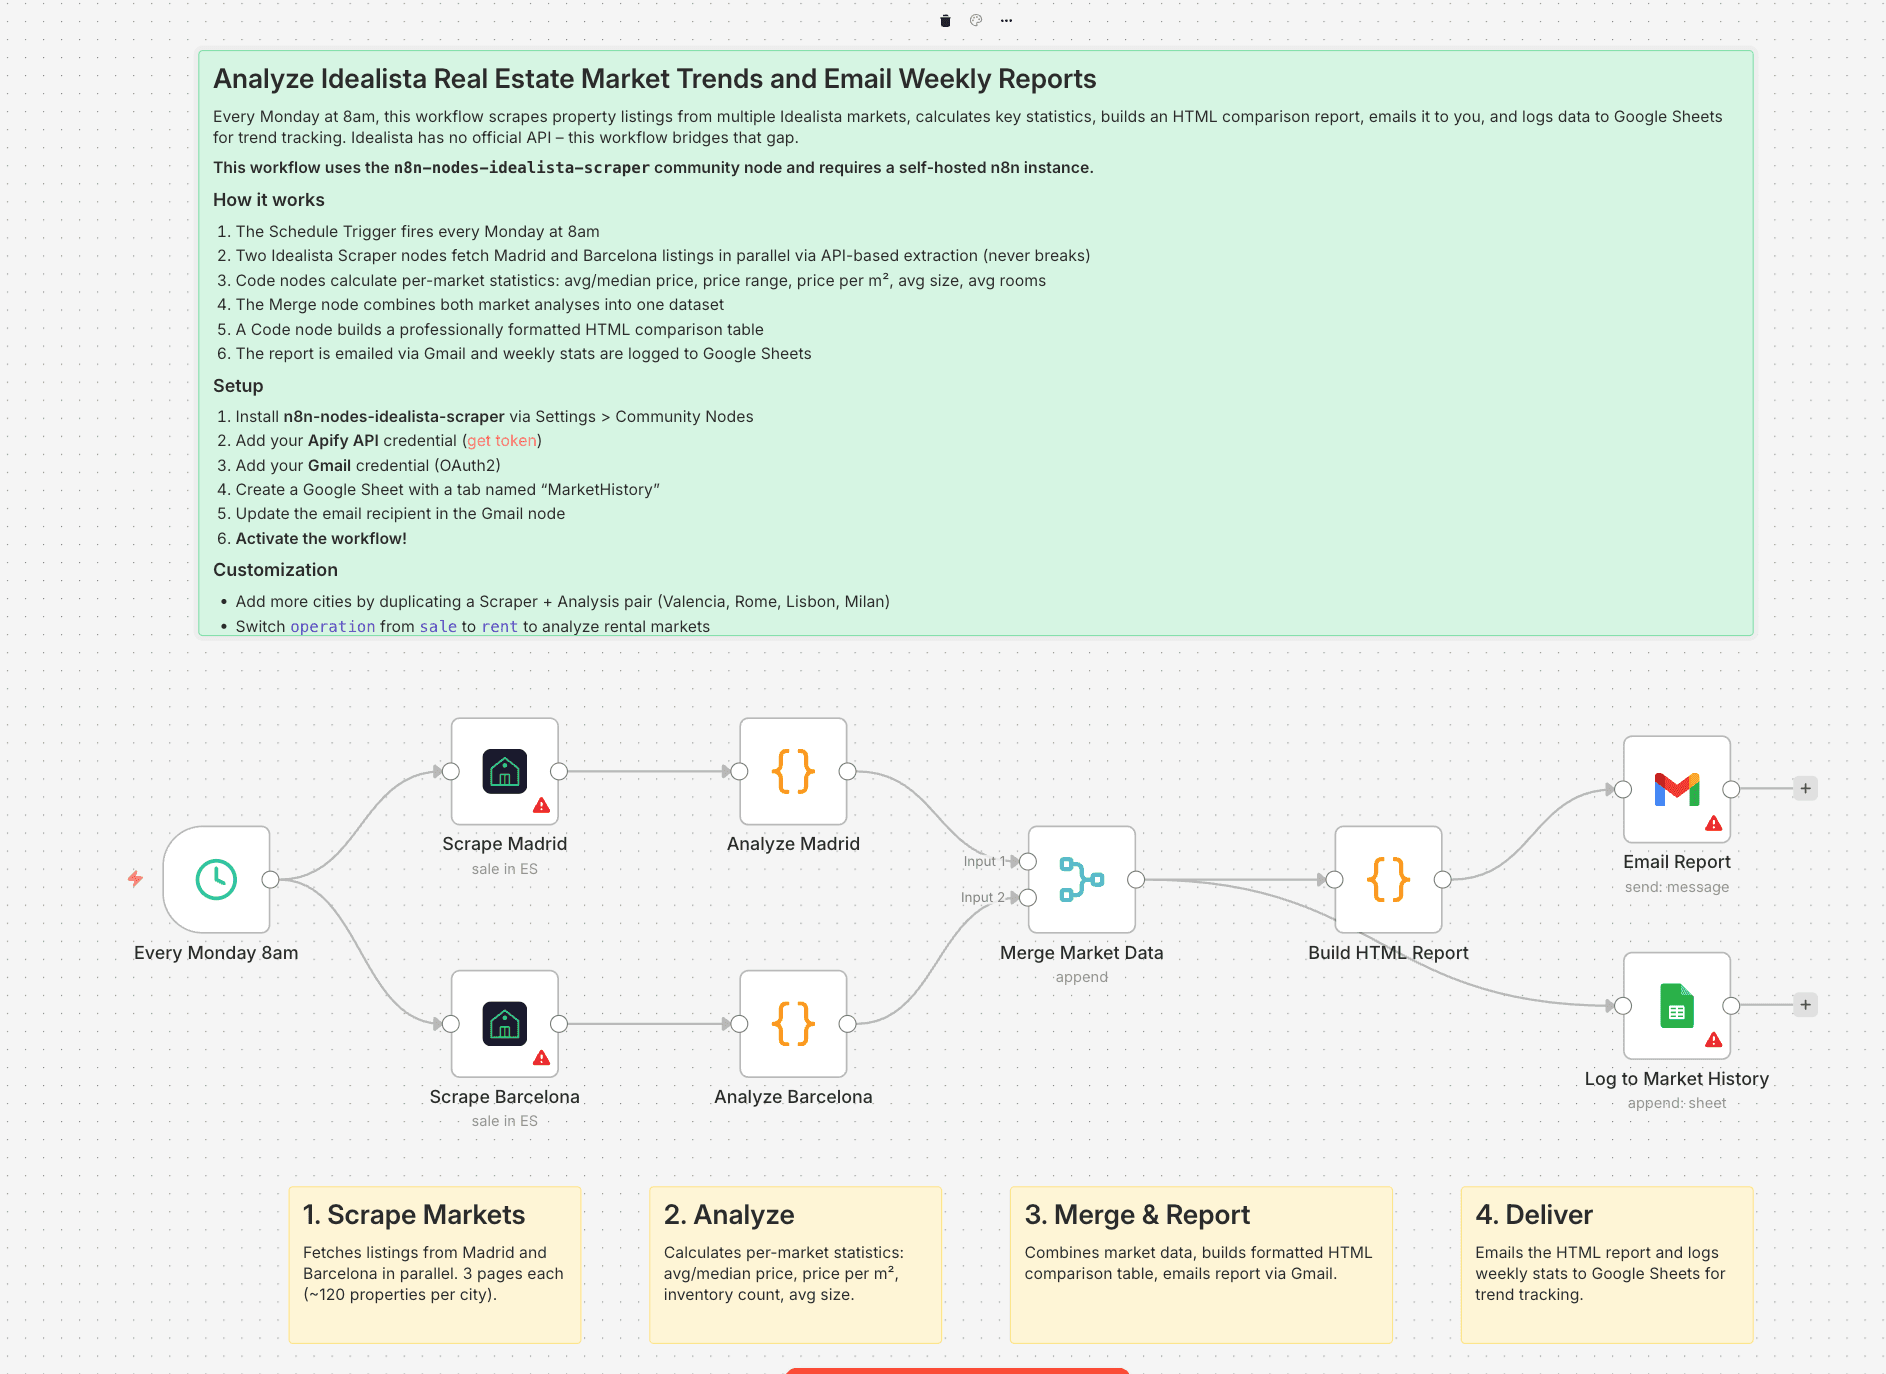
Every Monday at 8am, this workflow scrapes property listings from multiple Idealista markets, calculates key statistics, builds an HTML comparison report, emails it to you, and logs data to Google Sheets for long-term trend tracking.
- The Schedule Trigger fires every Monday at 8am
- Two Idealista Scraper nodes fetch Madrid and Barcelona listings in parallel via API-based extraction (never breaks)
- Code nodes calculate per-market statistics: average/median price, price range, price per m², average size, average rooms
- The Merge node combines both market analyses into one dataset
- A Code node builds a professionally formatted HTML comparison table
- The report is emailed via Gmail and weekly stats are logged to Google Sheets
Idealista has no official API and no built-in market analytics. This workflow turns raw listing data into actionable market intelligence, automatically, every week.
Setup
- Install n8n-nodes-idealista-scraper via Settings > Community Nodes (self-hosted n8n only)
- Add your Apify API credential (get token)
- Add your Gmail credential (OAuth2)
- Create a Google Sheet with a tab named "MarketHistory"
- Update the email recipient in the Gmail node
- Activate the workflow
Requirements
- Self-hosted n8n instance (community node not available on n8n Cloud)
- Apify account with API token
- Gmail account with OAuth2 credential configured in n8n
- Google Sheets account with OAuth2 credential configured in n8n
How to customize this workflow
- Add more cities by duplicating a Scraper + Analysis pair (Valencia, Rome, Lisbon, Milan)
- Switch
operationfromsaletorentto analyze rental markets - Add price filters to focus on specific segments (luxury above 1M EUR, budget below 200K EUR)
- Calculate rental yield by scraping both sale and rent for the same area
- Add an IF node after analysis to send alerts when average price drops below a threshold
- Cost: ~$0.50/week (2 markets x 3 pages x ~40 properties each)