Back to Templates


What Does This Flow Do?
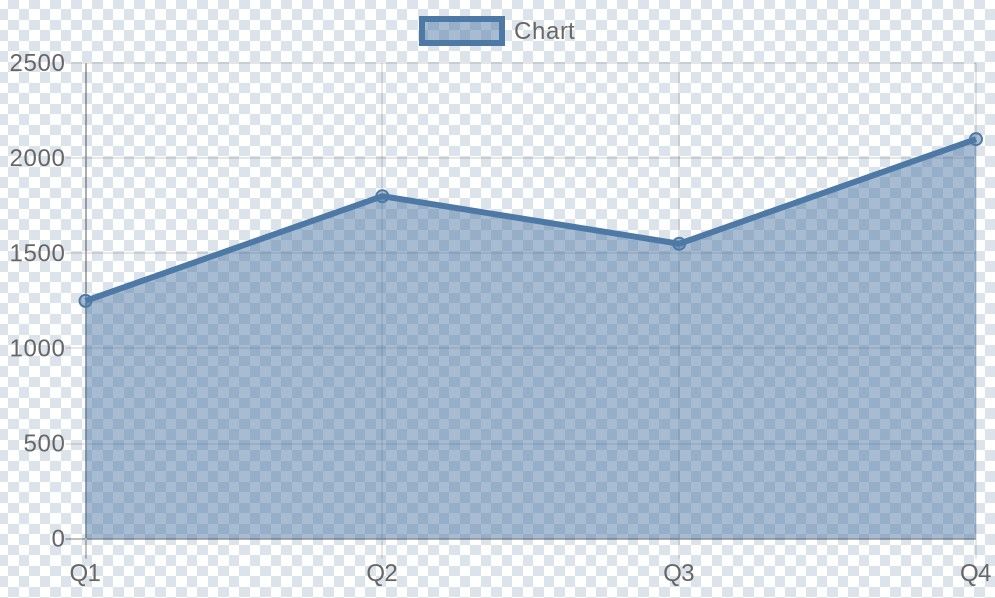
This workflow demonstrates how to dynamically generate a line chart using the QuickChart node based on data provided in a JSON object and then upload the resulting chart image to Google Drive.
Use Cases
- You can use it in presentations or requesting for chart generation from a software with HTTP requests.
- Automated report generation (e.g., daily sales charts).
- Visualizing data fetched from APIs or databases.
- Simple monitoring dashboards.
- Adding charts to internal tools or notifications.
How it Works
- Trigger: The workflow starts manually when you click 'Test workflow'.
- Set Sample Data: A Set node (
Edit Fields: Set JSON data to test) defines a sample JSON object namedjsonData. This object contains:reportTitle: A title (not used in the chart generation in this example, but useful for context).labels: An array of strings representing the labels for the chart's X-axis (e.g., ["Q1", "Q2", "Q3", "Q4"]).salesData: An array of numbers representing the data points for the chart's Y-axis (e.g., [1250, 1800, 1550, 2100]).
- Generate Chart: The QuickChart node is configured to:
- Create a
linechart. - Dynamically read labels from the
jsonData.labelsarray (Labels Mode: From Array). - Use the
jsonData.salesDataarray as the input data (Note: This configuration places data in the top-level 'Data' field. For more complex charts with multiple datasets or specific dataset options, configure datasets under 'Dataset Options' instead). - The node outputs the generated chart image as binary data in a field named
data.
- Create a
- Upload to Google Drive: The Google Drive node (
Google Drive: Upload File):- Takes the binary data (
data) from the QuickChart node. - Uploads the image to your specified Google Drive folder.
- Dynamically names the file based on its extension (e.g.,
chart.png).
- Takes the binary data (
Setup Steps
- Import: Import this template into your n8n instance.
- Configure Google Drive Credentials:
- Select the
Google Drive: Upload Filenode. - You MUST configure your own Google Drive credentials. Click on the 'Credentials' dropdown and either select existing credentials or create new ones by following the authentication prompts.
- Select the
- (Optional) Customize Google Drive Folder: In the
Google Drive: Upload Filenode, you can change theDrive IDandFolder IDto specify exactly where the chart should be uploaded. - Activate: Activate the workflow if you want it to run automatically based on a different trigger.
How to Use & Customize
- Change Input Data: Modify the
labelsandsalesDataarrays within theEdit Fields: Set JSON data to testnode to use your own data. Ensure the number of labels matches the number of data points. - Use Real Data Sources: Replace the
Edit Fields: Set JSON data to testnode with nodes that fetch data from real sources like:- HTTP Request (APIs)
- Postgres / MongoDB nodes (Databases)
- Google Sheets node
- Ensure the output data from your source node is formatted similarly (providing
labelsandsalesDataarrays). You might need another Set node to structure the data correctly before the QuickChart node.
- Change Chart Type: In the QuickChart node, modify the
Chart Typeparameter (e.g., change fromlinetobar,pie,doughnut, etc.). - Customize Chart Appearance: Explore the
Chart Optionsparameter within the QuickChart node to add titles, change colors, modify axes, etc., using QuickChart's standard JSON configuration options. - Use Datasets (Recommended for Complex Charts): For multiple lines/bars or more control, configure datasets explicitly in the QuickChart node:
- Remove the expression from the top-level
Datafield. - Go to
Dataset Options->Add option->Add dataset. - Set the
Datafield within the dataset using an expression like{{ $json.jsonData.salesData }}. - You can add multiple datasets this way.
- Remove the expression from the top-level
- Change Output Destination: Replace the
Google Drive: Upload Filenode with other nodes to handle the chart image differently:Write Binary File: Save the chart to the local filesystem where n8n is running.Slack/Discord/Telegram: Send the chart to messaging platforms.Move Binary Data: Convert the image to Base64 to embed in HTML or return via webhook response.
Nodes Used
- Manual Trigger
- Set
- QuickChart
- Google Drive
Tags: (Suggestions for tags field)
QuickChart, Chart, Visualization, Line Chart, Google Drive, Reporting, Automation