Back to Templates


Overview
This comprehensive workflow transforms Excel spreadsheets into professional, AI-generated reports with automated analysis and insights. Whether you're dealing with financial data, customer tracking, sales metrics, inventory management, or any structured data in Excel format, this template leverages artificial intelligence to create detailed, actionable reports with visualizations and key findings.
How It Works
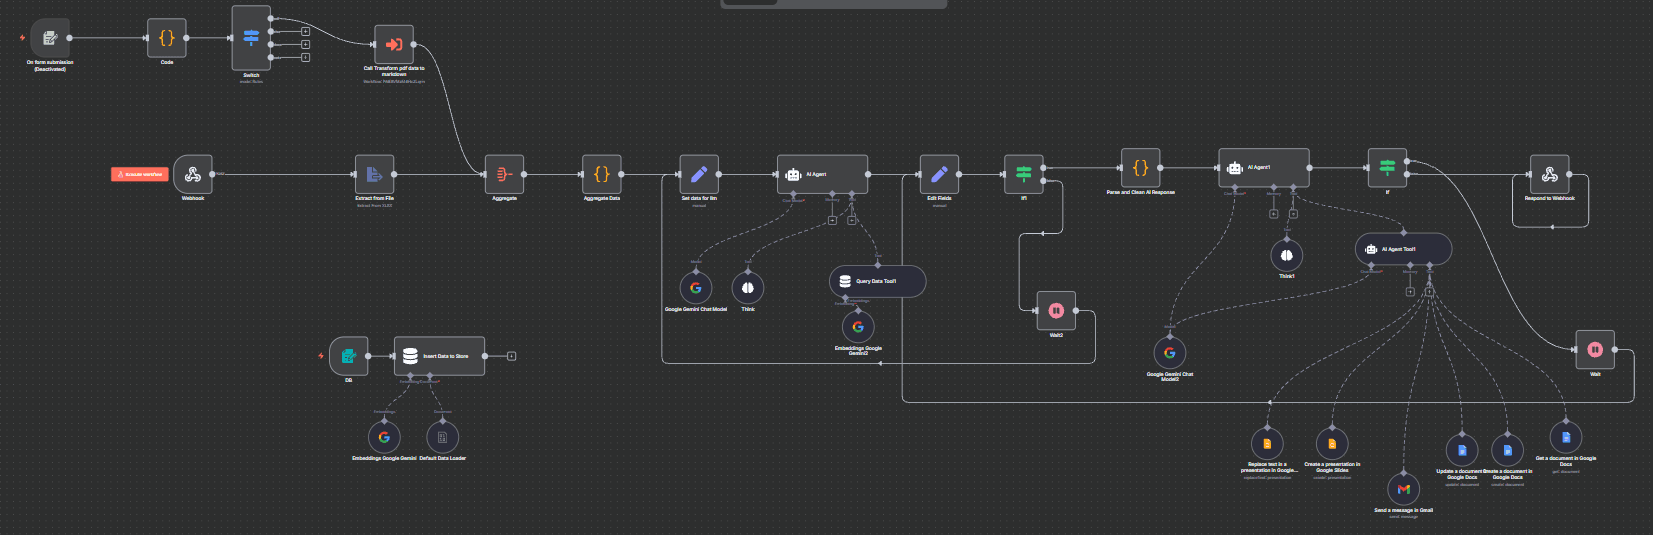
Automated Report Generation Pipeline:
- File Processing Trigger: Workflow initiates when Excel files are uploaded through a web form or file system
- Data Extraction & Validation: Automatically reads Excel sheets, validates data structure, and identifies key metrics
- AI-Powered Analysis: Uses advanced language models to analyze data patterns, trends, and anomalies
- Report Generation: Creates comprehensive reports with executive summaries, detailed analysis, and actionable recommendations
- Multi-Format Output: Generates reports in various formats (PDF, HTML, Word) with embedded charts and visualizations
- Automated Distribution: Sends completed reports via email or saves to designated cloud storage locations
Setup Instructions
Estimated Setup Time: 10-15 minutes
Prerequisites
- n8n instance (v0.200.0 or higher)
- OpenAI/Claude API key for AI analysis
- Email service credentials (for report distribution)
- Cloud storage access (Google Drive, Dropbox, etc.) - optional
Configuration Steps
-
Configure File Input Trigger
- Set up webhook or file system trigger for Excel file uploads
- Configure accepted file formats (.xlsx, .xls, .csv)
- Add file size and validation checks
-
Setup Data Processing Nodes
- Configure Excel file reader with sheet selection options
- Set up data validation and cleaning processes
- Define column mapping and data type recognition
-
Configure AI Analysis Engine
- Add your AI service API credentials (OpenAI, Anthropic, etc.)
- Customize analysis prompts based on your data types
- Set up context-aware report generation parameters
-
Setup Report Generation
- Configure report templates for different data types
- Set up chart generation and data visualization options
- Define output formats and styling preferences
-
Configure Distribution Channels
- Set up email service for automated report delivery
- Configure cloud storage integration for report archiving
- Add notification systems for completion alerts
Use Cases
Financial Reporting
- Budget Analysis: Analyze spending patterns and budget variance reports
- P&L Statements: Generate profit and loss summaries with trend analysis
- Cash Flow Reports: Create comprehensive cash flow analysis with forecasting
- Expense Tracking: Automated expense categorization and spending insights
Sales & CRM Analytics
- Sales Performance: Generate sales team performance reports with KPIs
- Customer Analysis: Create customer segmentation and lifetime value reports
- Lead Tracking: Analyze conversion funnels and lead quality metrics
- Territory Management: Regional sales analysis and market penetration reports
Operations Management
- Inventory Reports: Stock level analysis with reorder recommendations
- Project Tracking: Progress reports with timeline and resource analysis
- Quality Metrics: Performance dashboards with trend identification
- Resource Planning: Capacity utilization and allocation reports
HR & Administrative
- Employee Performance: Generate comprehensive performance review reports
- Attendance Tracking: Analyze attendance patterns and productivity metrics
- Training Records: Skills gap analysis and training effectiveness reports
- Compliance Reporting: Regulatory compliance status and audit reports
Key Features
- Intelligent Data Recognition: Automatically identifies data types and relationships
- Contextual Analysis: AI provides industry-specific insights and recommendations
- Professional Formatting: Clean, corporate-ready report layouts
- Interactive Visualizations: Embedded charts, graphs, and data visualizations
- Executive Summaries: AI-generated executive summaries highlighting key findings
- Trend Analysis: Historical data comparison and future projections
- Anomaly Detection: Automatically flags unusual patterns or outliers
- Multi-Language Support: Generate reports in multiple languages
- Batch Processing: Handle multiple files simultaneously
- Error Handling: Robust error management with detailed logging
Technical Requirements
- n8n instance with sufficient memory for Excel processing (minimum 2GB RAM recommended)
- AI service API access (OpenAI GPT-4, Claude, or similar)
- Email service (Gmail, Outlook, SendGrid, etc.)
- Optional: Cloud storage service credentials
- Stable internet connectivity for AI API calls
Supported Data Types
- Financial Data: Revenue, expenses, budgets, forecasts
- Sales Data: Transactions, leads, customer information, pipeline data
- Operational Data: Inventory, production metrics, quality scores
- HR Data: Employee records, performance metrics, attendance
- Marketing Data: Campaign metrics, conversion rates, ROI analysis
- Custom Data: Any structured Excel data with clear column headers
Output Options
- PDF Reports: Professional PDF documents with embedded charts
- HTML Dashboards: Interactive web-based reports
- Word Documents: Editable Word reports with tables and charts
- Excel Summaries: Enhanced Excel files with analysis sheets
- PowerPoint Presentations: Executive presentation slides
Advanced Features
- Custom Branding: Add your company logo and branding to reports
- Scheduled Processing: Set up automated report generation schedules
- Template Customization: Create custom report templates for different data types
- Integration Ready: Easy integration with existing business systems
- Audit Trail: Complete logging of all processing steps and data changes
Support & Troubleshooting
For optimal performance, ensure your Excel files have clear column headers and consistent data formatting. The AI analysis works best with clean, well-structured data. For complex financial calculations, verify results against your existing systems during initial setup.