Back to Templates


Tags: Supply Chain, Inventory Management, ABC Analysis, Pareto Principle, Demand Variability, Automation, Google Sheets
Context
Hi! I’m Samir — a Supply Chain Engineer and Data Scientist based in Paris, and founder of LogiGreen Consulting.
I help companies optimise inventory and logistics operations by combining data analytics and workflow automation.
This workflow is part of our inventory optimisation toolkit, allowing businesses to perform ABC classification and Pareto analysis directly from their transactional sales data.
Automate inventory segmentation with n8n!
📬 For business inquiries, feel free to connect with me on LinkedIn
Who is this template for?
This workflow is designed for supply chain analysts, demand planners, or inventory managers who want to:
- Identify their top-performing items (Pareto 80/20 principle)
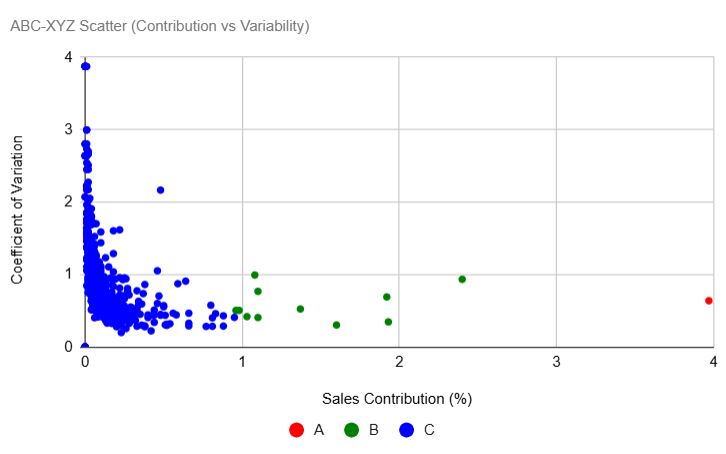
- Classify products into ABC categories based on sales contribution
- Evaluate demand variability (XYZ classification support)
Imagine you have a Google Sheet where daily sales transactions are stored:
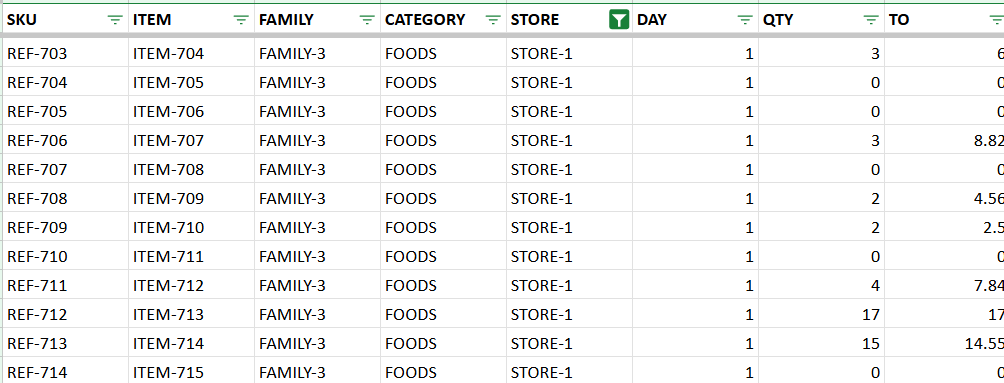
The workflow aggregates sales by item, calculates cumulative contribution, and assigns A, B, or C classes. It also computes mean, standard deviation, and coefficient of variation (CV) to highlight demand volatility.
How does it work?
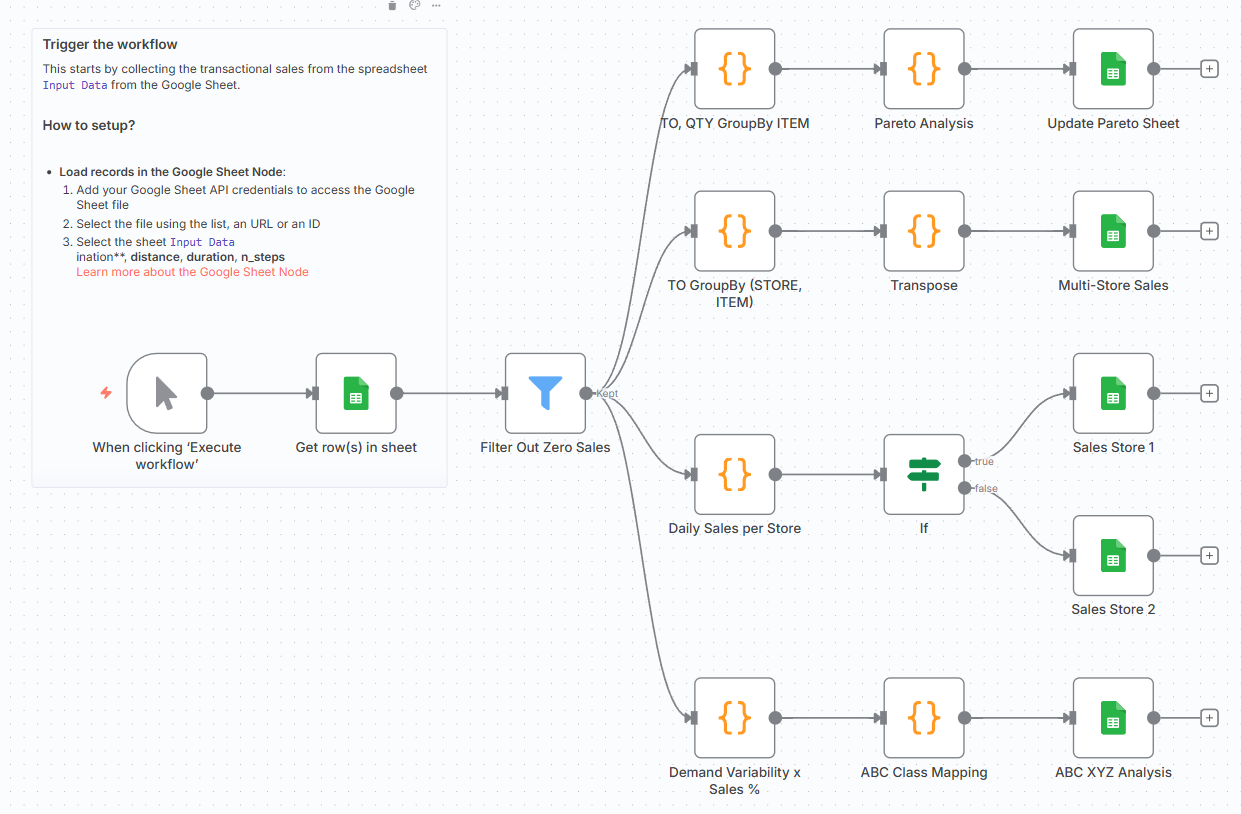
This workflow automates the process of ABC & Pareto analysis from raw sales data:
- 📊 Google Sheets input provides daily transactional sales
- 🧮 Aggregation & code nodes compute sales, turnover, and cumulative shares
- 🧠 ABC class mapping assigns items into A/B/C buckets
- 📈 Demand variability metrics (XYZ) are calculated
- 📑 Results are appended into dedicated Google Sheets tabs for reporting

Steps:
- 📝 Load daily sales records from Google Sheets
- 🔎 Filter out items with zero sales
- 📊 Aggregate sales by store, item, and day
- 📈 Perform Pareto analysis to calculate cumulative turnover share
- 🧮 Compute demand variability (mean, stdev, CV)
- 🧠 Assign ABC classes based on cumulative share thresholds
- 📥 Append results into ABC XYZ and Pareto output sheets
What do I need to get started?
You’ll need:
- A Google Sheet with sales transactions (date, item, quantity, turnover) that is available here: Test Sheet
- A Google Sheets account connected in n8n
- Basic knowledge of inventory analysis (ABC/XYZ)
Next Steps
🗒️ Use the sticky notes in the n8n canvas to:
- Add your Google Sheets credentials
- Replace the Sheet ID with your own sales dataset
- Run the workflow and check the output tabs: ABC XYZ, Pareto, and Store Sales
This template was built using n8n v1.107.3
Submitted: September 15, 2025