🧾 Summary
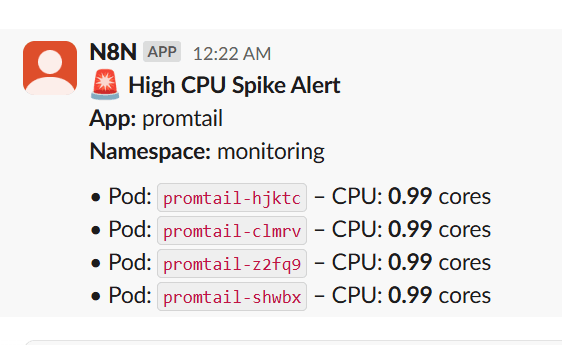
This workflow monitors Kubernetes pod CPU usage using Prometheus, and sends real-time Slack alerts when CPU consumption crosses a threshold (e.g., 0.8 cores). It groups pods by application name to reduce noise and improve clarity, making it ideal for observability across multi-pod deployments like Argo CD, Loki, Promtail, applications etc.
👥 Who’s it for
Designed for DevOps and SRE teams and platform teams, this workflow is 100% no-code, plug-and-play, and can be easily extended to support memory, disk, or network spikes. It eliminates the need for Alertmanager by routing critical alerts directly into Slack using native n8n nodes.
⚙️ What it does
This n8n workflow polls Prometheus every 5 minutes ⏱️, checks if any pod's CPU usage crosses a defined threshold (e.g., 0.8 cores) 🚨, groups them by app 🧩, and sends structured alerts to a Slack channel 💬.
🛠️ How to set up
🔗 Set your Prometheus URL with required metrics (container_cpu_usage_seconds_total, kube_pod_container_resource_limits)
🔐 Add your Slack bot token with chat:write scope
🧩 Import the workflow, customize:
Threshold (e.g., 0.8 cores)
Slack channel
Cron schedule
📋 Requirements
- A working Prometheus stack with kube-state-metrics
- Slack bot credentials
- n8n instance (self-hosted or cloud)
🧑💻 How to customize
🧠 Adjust threshold values or query interval
📈 Add memory/disk/network usage metrics
💡 This is a plug-and-play Kubernetes alerting template for real-time observability.
🏷️ Tags:
Prometheus, Slack, Kubernetes, Alert, n8n, DevOps, Observability, CPU Spike, Monitoring
Prometheus Spike Alert to Slack
