Back to Templates


What this workflow does
This workflow automates end-to-end stock analysis using real market data and AI:
-
Reads a list of stock tickers from Google Sheets
-
Fetches fundamental data (valuation, growth, profitability) and OHLCV price data from EODHD APIs
-
Computes key technical indicators (RSI, SMA 20/50/200, volatility, support & resistance)
-
Uses an AI model to generate:
- Buy / Watch / Sell recommendation
- Entry price, stop-loss, and take-profit levels
- Investment thesis, pros & cons
- Fundamental quality score (1–10)
-
Stores the final structured analysis back into Google Sheets
This creates a repeatable, no-code stock analysis pipeline ready for decision-making or dashboards.
Data source
Market data is powered by
EODHD APIs
How to configure this workflow
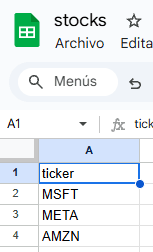
1. Google Sheets (Input)
Create a sheet with a column called:
ticker(e.g. MSFT, AAPL, AMZN)
Each row represents one stock to analyze.
2. EODHD APIs
- Create an EODHD account
- Get your API token
- Add it to the HTTP Request nodes as:
api_token=YOUR_API_KEY
3. AI Model
- Configure your AI provider (OpenAI / compatible model)
- The AI receives:
- Fundamentals
- Technical indicators
- Growth potential score
- It returns structured JSON with recommendations and trade levels
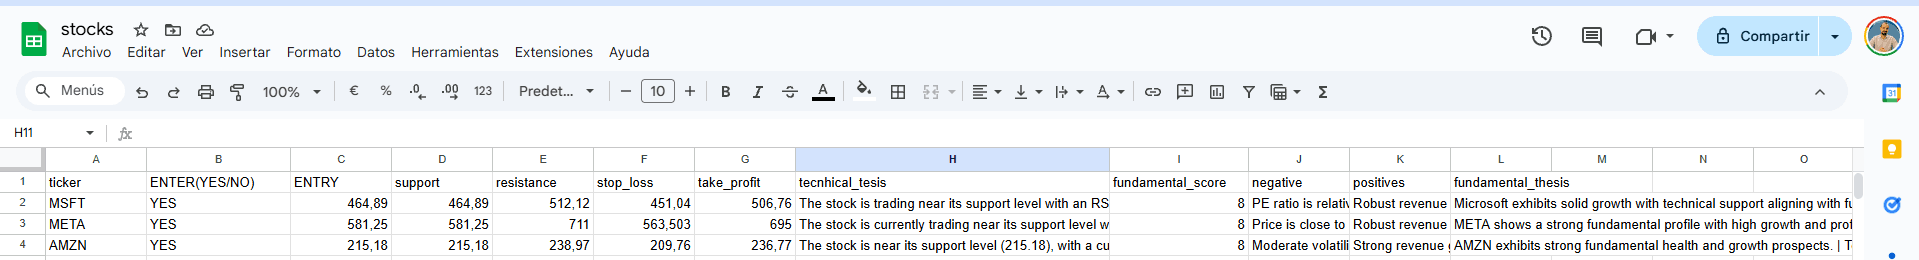
4. Google Sheets (Output)
Results are appended to a Signals tab with:
- Signal (BUY / WATCH / SELL)
- Entry, Stop Loss, Take Profit
- Fundamental score (1–10)
- Investment thesis and risk notes