Back to Templates


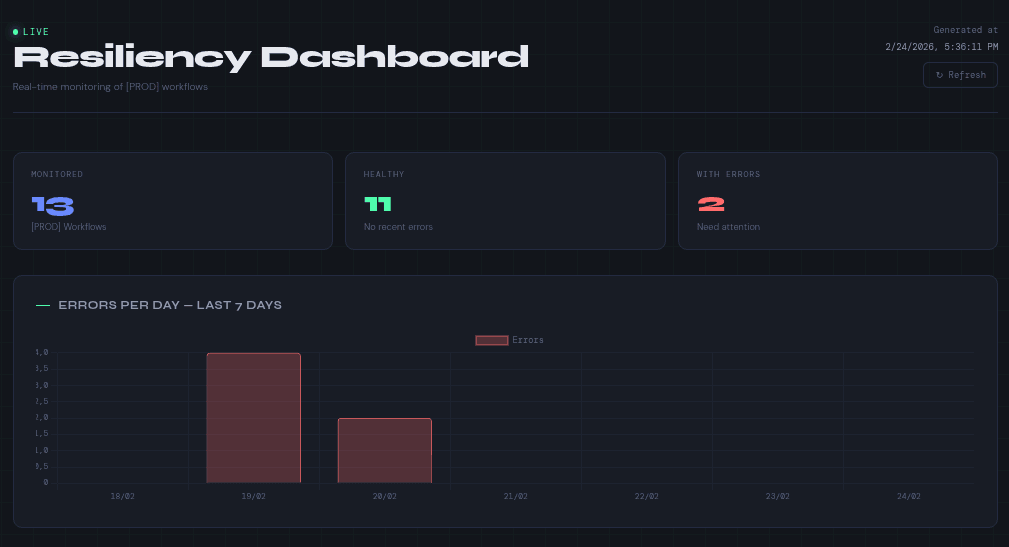
A real-time monitoring dashboard for your n8n production workflows, accessible directly from the browser via webhook.
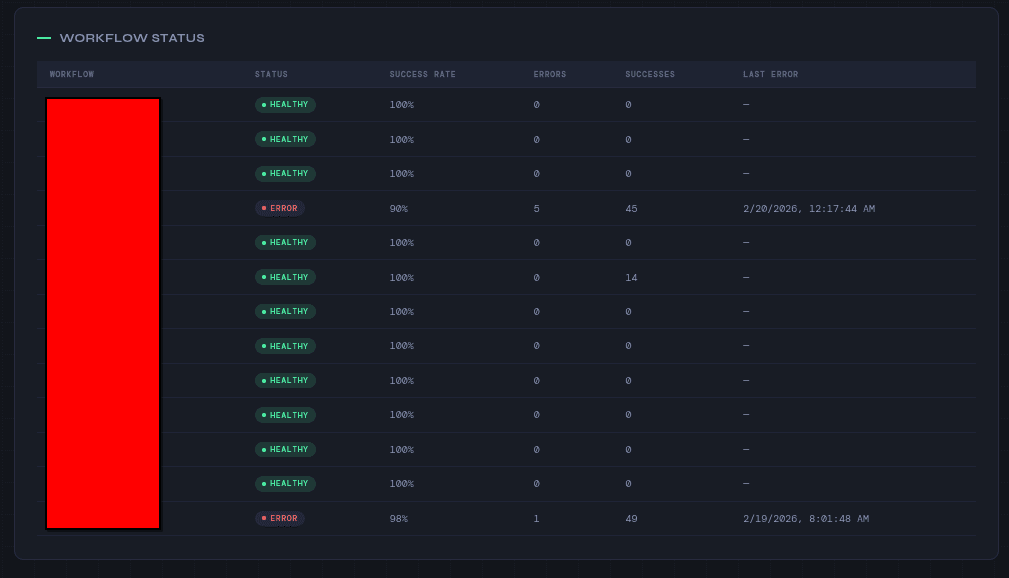
Tag any workflow with [PROD] and it will automatically appear on the dashboard showing:
→ Healthy vs error workflows
→ Success rate per workflow
→ Total errors and successes
→ Last error timestamp
→ 7-day error history chart
The dashboard auto-refreshes every 30 seconds. No external tools required — it uses only the n8n Public API.
How it works
When the webhook is triggered, the workflow:
- Fetches all workflows tagged [PROD] via the n8n API
- Retrieves the last 50 executions (success + error) for each workflow
- Calculates metrics and renders a dark-themed HTML dashboard
- Returns the dashboard directly in the browser
Requirements
- n8n self-hosted (any version with Public API enabled)
- n8n API credential configured
- At least one workflow tagged [PROD]
Setup
- Enable the n8n Public API under Settings → API
- Create an n8n API credential with your API key
- Open the Config node and set your n8n base URL
- Connect the credential to all HTTP Request nodes
- Activate the workflow and open the webhook URL in your browser