Back to Templates


Who's this for?
- If you own a website and need to analyze your Google analytics data
- If you need to create an SEO report on which pages are getting most traffic or how your google search terms are performing
- If you want to grow your site based on suggestions from data
Use case
Instead of hiring an SEO expert, I run this report weekly. It checks compares the data from this week to the week before:
- Views based on countries
- The top performing pages
- Google search console performance
Get my SEO A.I. agent system here
How it works
- The workflow gathers google analytics for the past 7 days then it gathers the data for the week before for comparison.
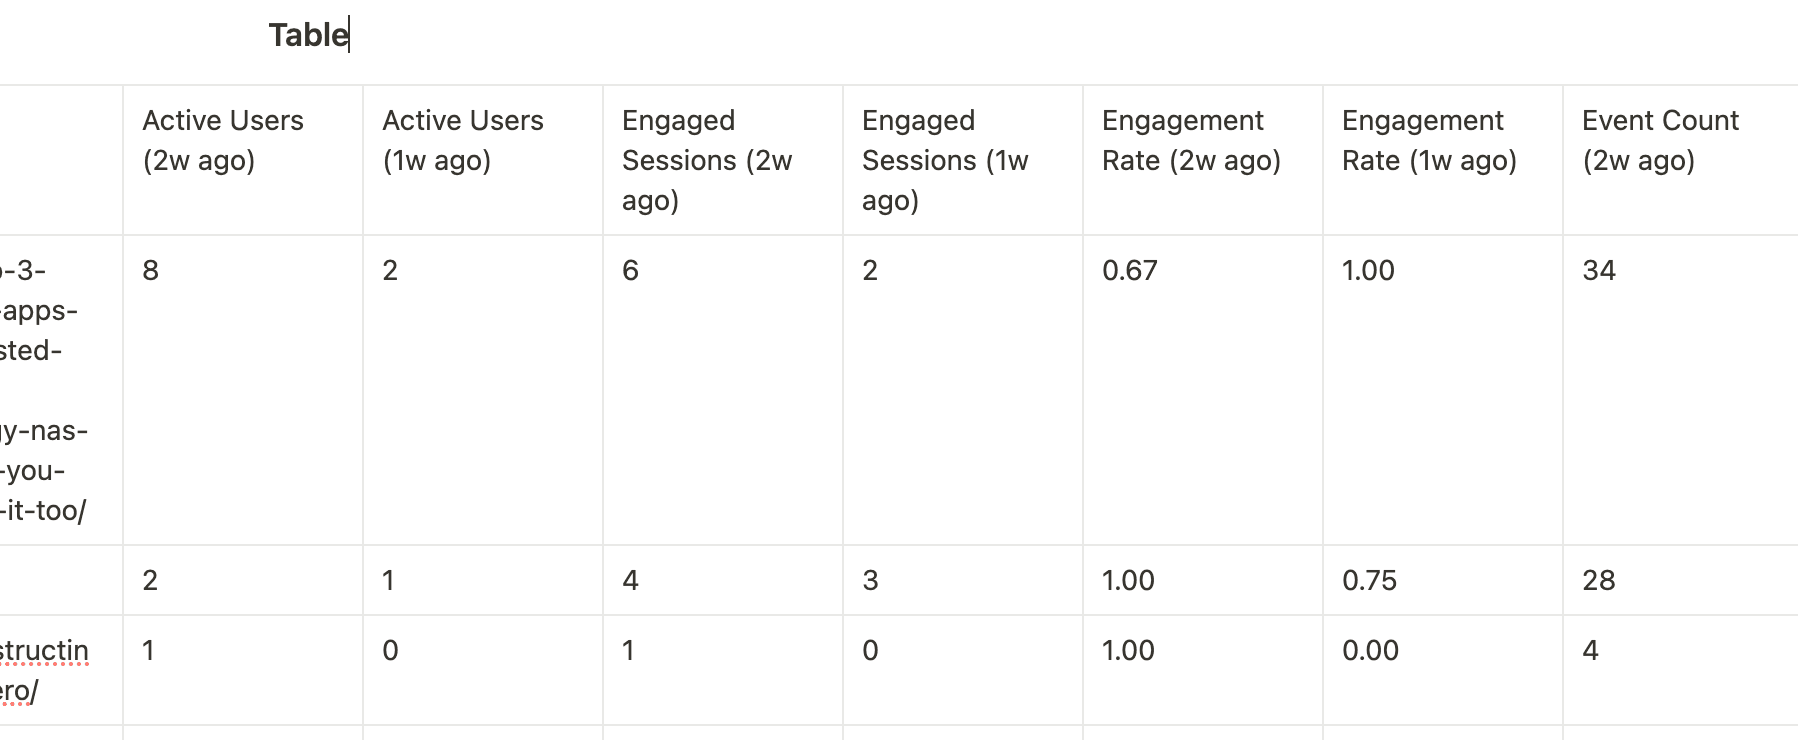
- It does this 3 times to get: views per country, engagement per page and google search console results for organic search results.
- The google analytics nodes has already chosen the correct dimensions and metrics.
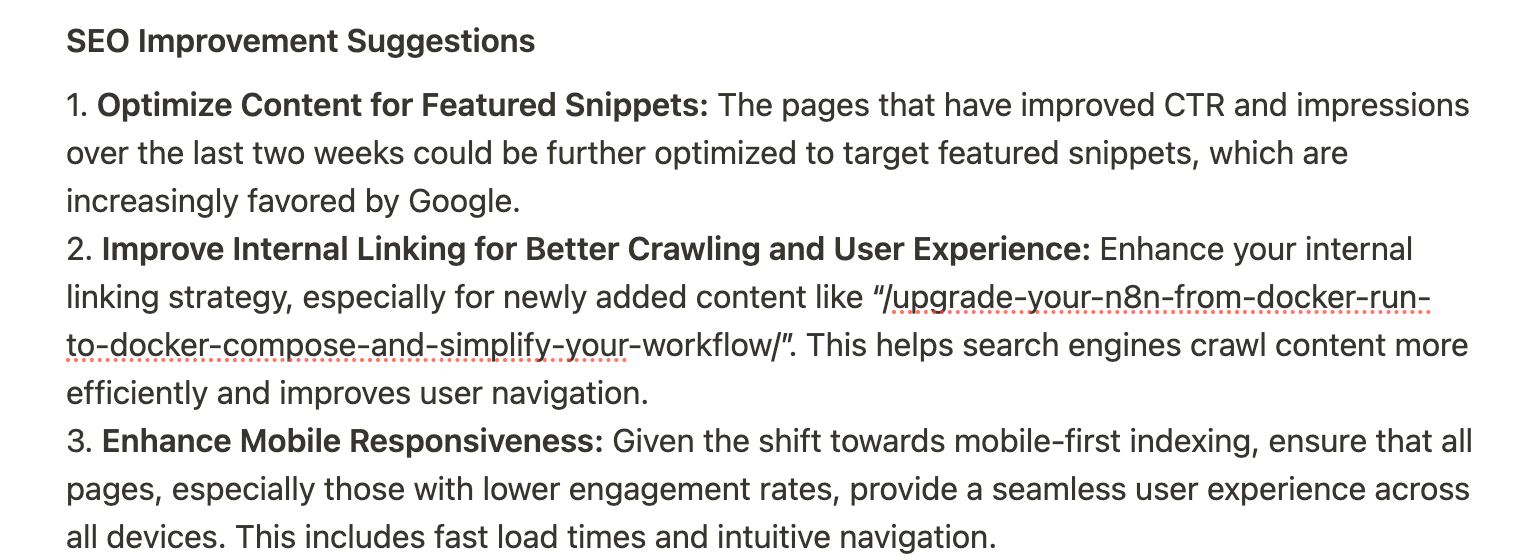
- At the end, it passes the data to openrouter.ai for A.I. analyse.
- Finally it saves to baserow.
How to use this
- Input your Google analytics credentials
- Input your property ID
- Input your Openrouter.ai credentials
- Input your baserow credentials
- You will need to create a baserow database with columns: Name, Country Views, Page Views, Search Report, Blog (name of your blog).
Created by Rumjahn