Back to Templates


Summary
This n8n workflow automates Kubernetes root cause analysis (RCA) and incident alerting by integrating with Loki, Prometheus, and Slack. It streamlines log collection, cluster health monitoring, and AI-driven RCA with Gemini, saving DevOps teams hours of manual troubleshooting. Designed for production-grade Kubernetes environments, this plug-and-play workflow delivers actionable insights directly to your Slack channels.
Who’s It For
🛠️ DevOps Engineers automating Kubernetes monitoring and incident response.
🔍 Site Reliability Engineers (SREs) aiming to reduce mean time to resolution (MTTR).
🚀 Teams using n8n, Slack, Loki, and Prometheus for observability and automation.
What It Does
- Pulls logs from Loki, filtering for critical errors.
- Monitors cluster health, checking pending, not ready, or restarting pods.
- Fetches Prometheus metrics for nodes, namespaces, and services.
- Generates AI-driven RCA using Google Gemini to analyze logs and metrics.
- Sends formatted Slack alerts with deduplication and batching for readability.
- Tracks pod lifecycle events, including crashloop states and restarts.
How It Works
- Log Collection: The workflow uses an n8n HTTP Request node to pull logs from Loki, filtering for critical errors.
- Cluster Monitoring: A Kubernetes SSH node checks pod states (terminated or running). If terminated ignore those pods for RCA.
- Metrics Fetching: Prometheus metrics are retrieved via HTTP Request for nodes and services.
- RCA Generation: Logs and metrics are merged into structured prompts for Google Gemini AI to produce actionable RCA insights.
- Kubernetes Enrichment: RCA from Gemini will goes to this node and enriches with Kubernetes documentation and provide the documentation links in RCA
- Slack Notifications: Alerts are batched, deduplicated, and sent to Slack with clear formatting.
How to Set Up
- Import the Workflow: Download the .json file and import it into your n8n instance.
Configure Credentials:
- Add your Loki, Prometheus, and Slack API credentials in the respective nodes (use n8n Credentials Manager if required).
- Set up Google Gemini AI credentials for RCA generation.
- Test the Workflow: Run the workflow manually to ensure logs, metrics, and alerts are processed correctly.
- Schedule Execution: Use n8n’s Schedule Trigger to run the workflow at desired intervals (e.g., every 5 minutes).
Requirements
🌐 n8 K8s node installed (self-hosted only, see n8n documentation).
🔑 Access to Kubernetes clusters and API.
📊 Loki and Prometheus set up for log and metrics collection.
💬 Slack workspace with webhook access for notifications.
🤖 Google Gemini AI API key for RCA generation.
How to Customize the Workflow
- Adjust Filters: Modify the Loki query in the HTTP Request node to focus on specific error patterns.
- Change Alert Frequency: Update the Schedule Trigger node for different intervals.
- Add More Metrics: Extend the Prometheus node to include additional metrics like CPU or memory usage.
- Customize Slack Alerts: Edit the Slack node to change message formatting or add more channels.
- Enhance RCA: Adjust the Gemini AI prompt in the Set Fields node for more specific insights.
🗂️ Category
DevOps / Monitoring & Observability / Kubernetes/ AI
🏷️ Tags
kubernetes, prometheus, slack, alerting, sre, ops, kube-state-metrics, Gemini, AI
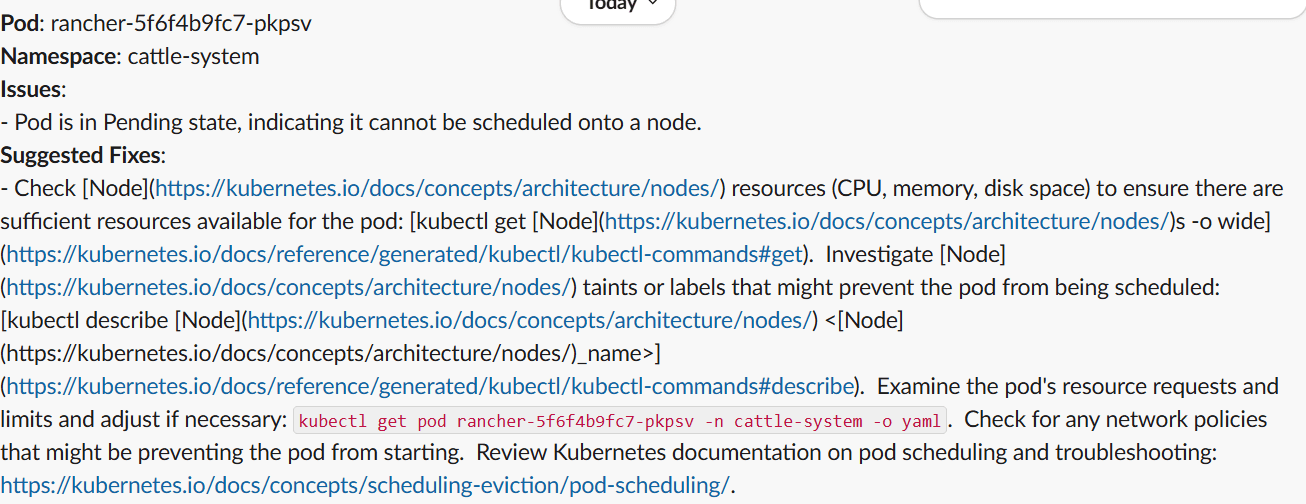
Slack Output